NCAER National Data Innovation Centre
Measurement Brief | 2023-03
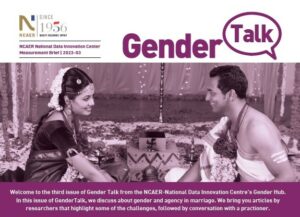
Welcome to the third issue of GenderTalk from the NCAER-National Data Innovation Centre’s Gender Hub. In this issue of GenderTalk, we discuss women’s agency in marriage choice. We bring you articles by researchers that highlight some of the issues, followed by conversation with a practioner.
GenderTalk is a space where scholars, policymakers, and civil society members can engage with each other on a theme vital to women’s well-being in India. For previous issues, scroll to the bottom.
In particular, this brief discusses the following:
 1. How much agency do Indian women have in marriage choices? – In this introductory article, using data from the Indian Human Development Survey (IHDS), Bipasa Banerjee(NCAER) finds that arranged marriages continue to thrive but educated women have a greater say in who they marry….more
 2. Freedom to Choose? Single Women and Reasons for Evading Marriage – In this article, Sarah Lamb (Brandeis University) examines whether women opt for singlehood by choice or circumstance, exploring the lives of 54 never-married women, ranging from age 35 to 92, in an ethnographic study….more
 3. Marriage, Motherhood and Agency: Adolescent Girls’ Experiences in India – Using two waves from the UDAYA survey, KG Santhya (Independent Researcher) and AJ Francis Zavier (Population Council) find that delayed marriage is associated with an increase in egalitarian gender role attitudes for young women.…more
 4. Indian Matchmaking: Are working women penalized in the marriage market? – Using a correspondence experiment design on Shaadi.com, Diva Dhar (Bill & Melinda Gates Foundation & Oxford Martin School finds that even among people using matrimonial websites, women who want to continue working after marriage get lower interest than women who do not plan to work….more
 5. The Emergence of Educational Hypogamy in India In this article, using data from the IHDS, Zhiyong Lin (University of Texas at San Antonio) show that the proportion of women who marry men with lower education levels than themselves increased from about 5% to nearly 20% between 1970s and 2000s…more
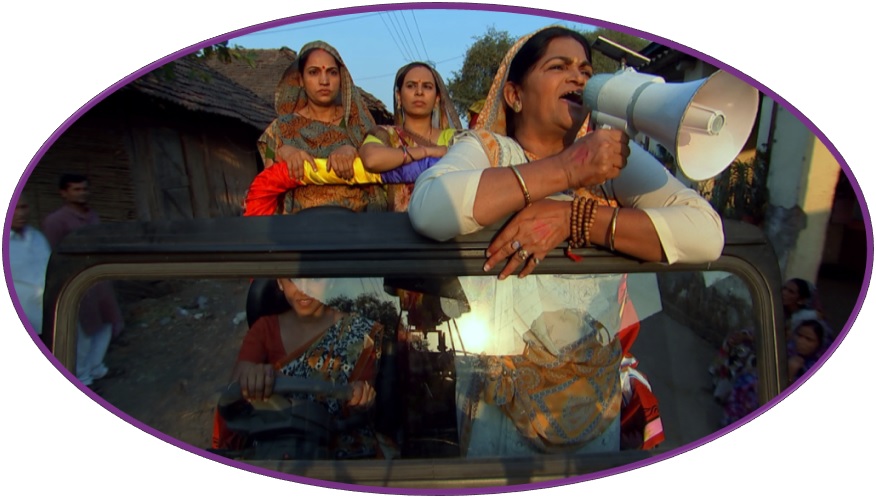 6. Conversation with Poonam Muttreja ( Population Foundation of India) on the flagship entertainment-education initiative “Main Kuch Bhi Kar Sakti Hoon” (I, A Woman, Can Achieve Anything’) and its role in empowering women, especially young adolescent girls, to raising their voices against the practice of early marriage, showing confidence to discuss and negotiate on issues such as family planning and domestic violence….more
READS…from around the web
Allendorf, K., & Pandian, R. K. (2016). The decline of arranged marriage? Marital change and continuity in India. Population and Development Review, 42(3), 435–464. https://pubmed.ncbi.nlm.nih.gov/28344368/
Banerji, M., & Deshpande, A. S. (2021). Does ‘Love’ make a difference? Marriage choice and post-marriage decision-making power in India. Asian Population Studies, 17(2), 201-220. https://www.tandfonline.com/doi/abs/10.1080/17441730.2020.1852713
Dhar, D., (2023). Indian Matchmaking: Are Working Women Penalized in the Marriage Market? 1. Available at SSRN: https://ssrn.com/abstract=4479657
Jejeebhoy S, Acharya R, Alexander M, et al. Measuring agency among unmarried young women and men. Economic and Political Weekly. 2010; 45:56–64 https://knowledgecommons.popcouncil.org/departments_sbsr-pgy/1628/
Kaur, R. and Palriwala, R. (Eds.) Marrying in South Asia: Shifting concepts, changing practices in a globalising world. New Delhi: Orient Blackswan. https://orientblackswan.com/details?id=9789352872732
Lamb, S. (2022). Being Single in India: Stories of Gender, Exclusion, and Possibility. Oakland: University of California Press. Open Access digital version available free of charge: https://www.luminosoa.org/site/books/m/10.1525/luminos.125/ or via Amazon.com
Lin, Z., Desai, S., & Chen, F. (2020). The emergence of educational hypogamy in India. Demography, 57, 1215–1240. https://read.dukeupress.edu/demography/article/57/4/1215/168096
Click here to download the current measurement brief
This measurement brief is part of the Gender Hub led by Dr Pallavi Choudhuri and Dr Sonalde Desai.
Previous Issues of GenderTalk:
2023-02: Gender and Land Rights;
2023-01: Gender and Public Safety