Gender Data Hub

Overview: The NCAER National Data Innovation Centre plans to establish a gender data hub. This hub envisages using existing data and new data as a vehicle for engaging feminist scholars, activists, and policymakers. These stakeholders will be invited to undertake and/or guide gender-focused analyses of public policies—both women-focused and gender-neutral—in the economic, health, and educational domains in India. Some of the policies of interest include cash incentives for girls’ education, reducing inequalities in access to health services, and development of a social registry for improving access to government benefits. In recent years, Indian national data collection systems have faced considerable challenges. Lack of data, ironically at a time when data are most needed, has hampered both the evaluation of public policies and an understanding of women’s lived realities. Building a data-focused coalition that utilises diverse data sources will help bring feminist voices to the policy table in a non-partisan manner. Initial funding for the gender data hub is provided by Co-Impact.

Objectives: The overall goal is to shape a data-focused research agenda in conjunction with our civil society and government partners. The initiative will be a tripartite partnership between feminist activists and journalists, policymakers, and researchers. The team has unique access to data and statistical skills; civil society partners will offer an understanding of on-the-ground processes to help define policies that deserve evaluation and conditions that may limit policy impact; NCAER’s location within the Indian policy discourse will help to mobilise gender advocates within both the Government and the media to help disseminate the research results and establish policy linkages.

Indian Human Development Survey

A collaboration between NCAER and the Univeristy of Maryland, the Indian Human Development Survey (IHDS) was designed to complement existing Indian surveys by bringing together a wide range of indicators in a single survey. Unlike single-topic surveys, the IHDS collects data on different dimensions of human development like education, caste, gender relations and infrastructure. This breadth permits analyses of associations across a range of social and economic conditions. For example, studying indicators for children (e.g., learning, immunizations) requires joint consideration of the roles of poverty, family structure, gender relations, community context, and the availability of facilities.

The first round (IHDS-1) of the survey was completed in 2004-5 covering 41,554 urban and rural households in all states and union territories of India (except Andaman/Nicobar and Lakshadweep). The data are publicly available through ICPSR and are currently being used by about 7,000 users worldwide. During 2011-12, the second round (IHDS-II) re-interviewed the same households, creating one of the largest panel surveys in the world and providing a direct measure of India’s economic progress over seven years. The NCAER is currently collating the data from IHDS-II and the data are expected to be made public in early-2015.

Women’s Low Employment Rates in India: Cultural and Structural Explanations
By Esha Chatterjee and Reeve Vanneman

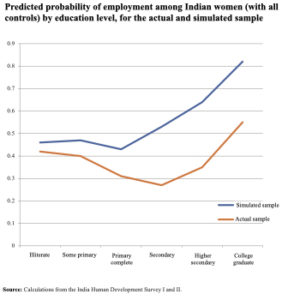
It has long been known that Indian women’s labour force participation rates have a U-shaped relationship with their education, rather than a more conventional positive linear relationship. The low rates of employment for moderately educated women are usually explained either as a result of the cultural stigma of women’s employment in a patriarchal society or because of the lack of demand from white-collar and light manufacturing jobs for women with middle levels of education. Using especially well-suited data from two waves of the India Human Development Survey, the authors test these explanations by examining the education–employment relationship in districts with low cultural stigma (low observance of purdah) and high proportions of (salaried) employment considered “suitable” for women. The paper finds little support for either the cultural or structural explanations: the education–employment relationship remains U-shaped in districts with low stigma or with more “suitable” salaried employment. Instead, the authors suggest that a better explanation lies in the high levels of gender segregation where most white-collar jobs are reserved for men. They simulate what the education–employment relationship would look like if these white-collar occupations were female dominated as they are in most places in the world and find a more conventional linear relationship.

Full Article Here

Esha Chatterjee is an Assistant Professor in the Department of Humanities and Social Sciences at the Indian Institute of Technology Kanpur. She received her PhD in Sociology from the University of Maryland, College Park, in 2020. Her primary research interests are in the fields of demography and gender, work and family. Her past and ongoing projects examine the relationship between women’s employment and education; fertility intentions, behaviour and maternal health, the unmet need for contraception, and internal migration in the Indian context. Her work has been published in peer-reviewed journals such as Journal of Ethnic and Migration Studies, Population Studies, PLOS ONE and Demographic Research. Her paper, “Indian paradox: Rising education, declining women’s employment” has been awarded the Editor’s choice award by Demographic Research, and has been featured in several prominent publications in India like The Hindu, ThePrint, and Livemint.

Reeve Vanneman is a sociologist at the University of Maryland whose research focuses on changing gender inequalities in the United States and India. With Sonal Desai and colleagues in Delhi at the National Council of Applied Economic Research (NCAER), he has helped field two waves of the India Human Development Survey (IHDS). With Dave Cotter and Joan Hermsen, he has investigated why the US gender revolution of the 1970s and 1980s stalled in the 1990s. His recent work with Joanna Motro has investigated whether changing cultural themes about working mothers may have contributed to this stalled gender revolution.

Revisiting the relationship between farm mechanization and labour requirement in India


By Pallavi Rajkhowa and Zaneta Kubik

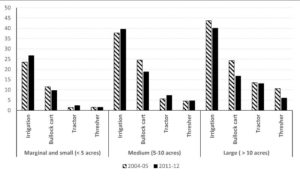
In many developing and emerging economies, better employment opportunities in the non-farm sector have increased rural wages due to labour shortages during the peak agricultural season. Increasing wages often cause a substitution of labour for mechanical power, but extensive use of labour-saving technologies may cause labour displacement and have serious equity concerns. Using the nationally representative India Human Development Survey (IHDS), this paper analyses the relationship between different types of farm machines and labour requirements in India. The results suggest that a unit increase in the level of farm mechanization increases the demand for hired labour by 12 per cent. Moreover, the authors find that the level of farm mechanization has a positive effect on women’s participation in farm work, while it decreases the probability of children participating in agriculture-related work. Disaggregated analysis based on types of farm machinery suggests that water-lifting equipment, draft power, and tractors increase the probability of male household members working on their farms, while all types of farm machines, except tractors, have a positive effect on female farm labour participation. The authors also find that the effect of farm mechanization on the demand for hired labour decreases as the size of the farm increases.

Full Article Here

Pallavi Rajkhowa is pursuing her PhD in Agriculture Economics from Center for Development Research (ZEF), University of Bonn, Germany. Prior to joining ZEF, Pallavi has worked at the Indian Council for Research on International Economic Relations (ICRIER), International Food Policy Research Institute (IFPRI), and Confederation of Indian Industry (CII) on various agriculture and food policy-related issues, as well as macro-economic analysis. Her current work seeks to understand the impact of digital technologies on development outcomes in India, particularly in the areas of agriculture, agricultural markets, and the rural non-farm sector.

Zaneta Kubik is a senior researcher at the Center for Development Research (ZEF), University of Bonn, Germany. She is a development economist with a background in economics and political science. She holds a PhD in Economics from the University of Paris 1 Panthéon Sorbonne in France. In her research, she focuses on labour markets, migration, and poverty analysis, in particular in the context of Sub-Saharan Africa and South Asia. She is also a lecturer in the Economics Department at the University of Bonn where she teaches development economics.

Poverty Monitoring

Overview: The COVID-19 pandemic has not only affected physical and mental health of people in India and around the world, it has impacted people’s livelihood, led to stagnation of economic growth and posed an unprecedented challenge to teaching and learning of students. Moreover, because of COVID-related pressure on the health system, the disruption of routine health services turned out to be a major area of concern in the wake of the COVID-19. With the availability of safe and efficacious vaccines and a reasonable level of vaccination coverage there is a ray of hope that the pandemic may be over soon. But the impact it has on the people of the country due to unexpected death of family members, loss of livelihood, decline in household income, school closures and inability to access temporary alternative methods of remote learning, lack of access to routine healthcare services can be long lasting. Based on the impact of COVID-19 on people’s lives, we assess the consequences faced by the vulnerable population and their risks of impoverishment. Using a combination of original qualitative data collected from a small number of affected people in India, interviews with local leaders and community development actors, and secondary data from a range of different sources, we focus on vulnerability of specific occupational groups, occupational shift during the pandemic, levels of distress and hardship experienced by the households, COVID and non-COVID health burden, limited learning activities because of school closure and online education, financial constraint to support children’s education, and issues of isolation and the lack of social bonds. Initial funding for this work is given by the ODI Chronic Poverty Advisory Network.

Delhi NCR Coronavirus Telephone Survey

Overview: In order to understand and quantify the early impact of the Coronavirus pandemic and the pandemic induced lockdown, the National Data Innovation Centre conducted telephone surveys in both the urban and rural areas of Delhi National Capital Region (NCR). So far we have completed four rounds of Delhi NCR Coronavirus Telephone Survey (DCVTS). The widespread use of mobile phones in India provided us with the opportunity of conducting surveys remotely during the pandemic when there was a need for scientifically collected data for decision making. Moreover, the telephone mode of data collection coupled with computer-assisted technology satisfies the need of a quick turnaround in the absence of travel time and helps in measuring or informing policy responses in a timely manner.

Objectives: The objectives of the first two rounds of DCVTS (DCVTS-1; April 3-6 & DCVTS-2; April 23-26) were to estimate the levels and changes over time in people’s knowledge, attitude, perception, and practiced behavior with respect to COVID-19. The surveys also estimated the impact of the Coronavirus pandemic on people’s, income, access to essential items, social life, and their coping mechanisms (NCAER National Data Innovation Centre 2020, NCAER National Data Innovation Centre 2020, Desai and Pramanik Apr 29, 2020, Desai and Pramanik April 20, 2020, Mazumdar, Pramanik et al. May 24, 2020 ).

The third round (June 15-23) focused on the ways in which the lockdowns have affected different occupational groups (Desai and Pramanik 05 Jul 2020), levels of distress and financial hardship experienced by households, how households access welfare measures during the early phases of the pandemic (Bornali Bhandari, Santanu Pramanik et al. August 3, 2020, Choudhuri and Desai November 28, 2020), challenges in getting back to work and remaining safe after the lockdowns were lifted, and trends in social distancing and risk perceptions as the lockdowns are eased.
DCVTS-4 (December 23, 2020 – January 4, 2021), launched right before the roll out of mass vaccination, explored issues such as vaccine hesitancy (Pramanik and Desai 2021), level of disruptions in routine healthcare, the extent of learning disruptions for children in the age group of 6-14 years (Banerji, Ashraf et al. 20 Feb 2021), occupational shifts during the pandemic, vulnerability among different occupational groups, and the levels of distress and financial hardship experienced by households and whether the most vulnerable households have had access to safety nets. An overview of the topics covered across different rounds of DCVTS is given in the figure below.

Figure: An overview of the topics covered across different rounds of DCVTS


Delhi Metropolitan Area Study

Overview:
In a dynamic research and policy environment with a growing demand for data, it is crucial to invest in methods of data collection leading to timely, high-quality and policy-relevant data. Delhi Metropolitan Area Study (DMAS), a flagship study of NCAER National Data Innovation Centre, serves as an incubator to experiment with innovations in data collection across various substantive domains such as household income, expenditure, borrowing; labor force participation; financial inclusion; health insurance and healthcare expenditure; education; gender equality and empowerment, among others. Two key objectives of DMAS are: 1) Conducting methodological experiments in data collection involving technological innovations and innovations in questionnaire designing; and 2) Demonstrating the feasibility and usefulness of remote monitoring of data collection activities to improve data quality.

Data collection for DMAS continued from 15th February, 2019 to 14th November, 2021, with a break of one and half-year during the COVID-19 pandemic. During this time, we completed DMAS baseline survey, 3 quarterly surveys, 30 rounds of monthly telephone surveys on employment, and finally the endline. Our inability to complete the 4th quarterly survey and the endline on time (which was supposed to happen during March-May 2020) has implications on our planned experiments because of comparability issues around reference period across the two experimental groups (one group of households receiving 4 quarterly surveys and the other group getting the annual reference period endline). So we will not be able to achieve some of the original objectives we had, as one can imagine, the last round of data collection is crucial for any evaluation study. However, DMAS endline has immense potential to capture the medium to long term economic, health and educational impact of the pandemic.

Study Design and Survey Methodology: The target geographical area for DMAS is the Delhi National Capital Region (NCR) which comprises 31 districts spread over four states, viz., Haryana (13 districts), Delhi (9 districts), Rajasthan (2 districts), and Uttar Pradesh (7 districts) . Although it may not be apparent from the name, Delhi NCR is a highly diverse region including the metropolitan areas of Delhi as well as rural areas of districts in Haryana, Rajasthan, and Uttar Pradesh. Within a state, we considered a multi-stage stratified cluster sampling design. Districts, clusters, and households were selected at the first, second, and third stages of sampling. Clusters or the secondary sampling units (SSUs) were defined as census villages in rural areas and NSS Urban Frame Survey (UFS) blocks in urban areas. The goal of the sampling design was to select representative random sample at each stages of selection.

Total number of households that completed DMAS baseline survey was 5,253. We considered equal allocation of sample across districts resulting in approximately 22 SSUs per district, with a few exceptions. Within a district, SSUs were allocated to urban (UFS blocks) and rural areas (villages) in proportion to the percentage of urban and rural households in the district. The median number of households surveyed from a SSU was 20. Equal number of households were considered from each SSU in order to manage the interviewer workload efficiently.

DMAS Implementation